3 The Meta-Analysis Workflow
What Are We Trying to Find?
Our research question:
Does exposure to PM₂.₅ during pregnancy increase the risk of adverse birth outcomes in low- and middle-income countries (LMICs)?
To answer this question systematically and rigorously, we conduct a meta-analysis, pooling data from published studies to generate a quantitative estimate of the association. This allows us to go beyond individual studies and detect global patterns across diverse populations.
How Does the Workflow Work?
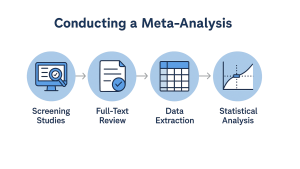
Meta-analysis isn’t one single task—it’s a pipeline made up of several coordinated steps. In this project, we divide that pipeline into four major phases:
1. Screening Studies in Covidence
We begin by searching academic databases for all potentially relevant papers. Covidence is the software we use to screen each study’s:
-
Title & Abstract: Does this paper look like it might involve PM₂.₅ and pregnancy?
-
Full Text: Does it report a usable effect estimate (like an odds ratio) linking PM₂.₅ to a birth outcome in an LMIC?
If so, we include it in our pool.
2. Extracting Data into Google Sheets
From each eligible paper, we extract key details:
-
Country and setting
-
Study design
-
PM₂.₅ exposure measurement
-
Outcome measured (e.g., preterm birth, low birth weight)
-
Effect size (e.g., OR, RR, HR), confidence intervals, and adjustments
We enter this information into a structured Google Sheet template to prepare for analysis.
3. Analyzing the Data in R
Once the data is cleaned and converted into a consistent format, we run the meta-analysis using R (specifically the metafor package). This generates:
-
Forest plots showing each study’s result and the pooled estimate
-
Heterogeneity measures like I²
-
Funnel plots to explore publication bias
You won’t need to code (unless you want to!), but understanding how your contributions lead to the final figures will help you appreciate the power of this process.
4. Interpreting & Sharing the Results
Finally, we interpret the findings:
-
What is the pooled odds of preterm birth per 10 μg/m³ increase in PM₂.₅?
-
Do effects vary by region or trimester?
-
Where is the evidence strongest—and where are the gaps?
Your work helps shape the answers to these questions and may even contribute to a published paper.
What You’ll Be Doing
As an undergraduate team member, your role might include:
-
Screening abstracts and full texts
-
Extracting data from papers
-
Checking conversions (e.g., RR to OR)
-
Helping track trimester-specific exposures
-
Flagging anything unclear so we can decide as a team
We’ll walk you through each step in the coming sections. You don’t need prior experience, just curiosity, care, and attention to detail.
Media Attributions
- Untitled design (1)